
Slow pages lose sales: what to measure and remove
Photo: Avila Ops Tecnologia
Slow pages lose sales because customers arriving from ads on mobile data do not wait. If a product page takes more than 2.5 seconds to show what matters, some return to Instagram before seeing the price. You paid for the click without getting a chance to sell.
Measure three Google PageSpeed Insights numbers: time until the largest element appears (LCP), interaction response delay during a visit (INP), and how much the page shifts while loading (CLS). In most small stores, remove uncompressed images, installed-and-forgotten apps, and fonts and scripts loading before content.
Which numbers matter, and what do they mean?
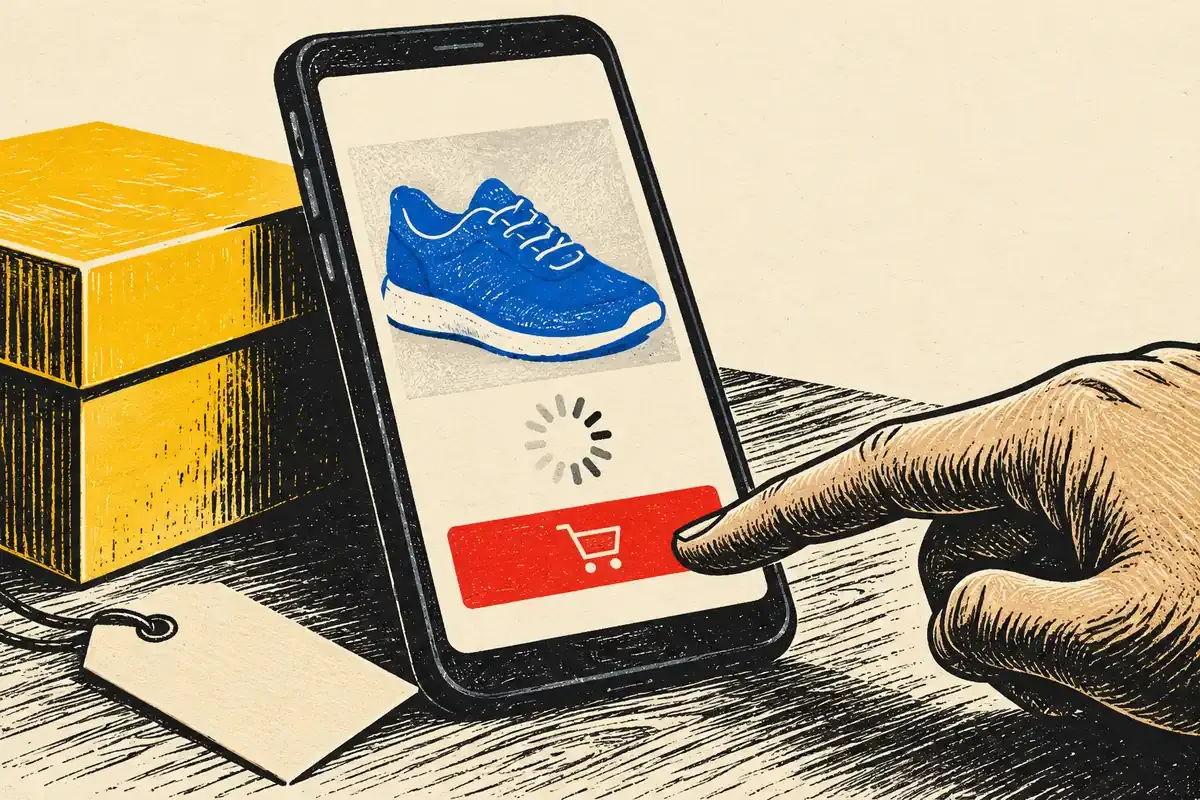
Photo: Avila Ops Tecnologia
LCP measures how long the largest visible element, usually a product photo or banner, takes to appear. Google considers up to 2.5 seconds good. INP measures how long the page takes to react to a button tap; good is up to 200 milliseconds. CLS measures content shifting during loading, causing wrong-button clicks; good is up to 0.1.
Test the homepage, a product page, and checkout, always on the “mobile” tab. Desktop results mislead: ad visitors use phones.
| Number | What it measures | Good up to |
|---|---|---|
| LCP | Time until the largest element appears | 2.5 s |
| INP | Interaction response delay | 200 ms |
| CLS | Layout shifts during loading | 0.1 |
| Page weight | Total downloaded on mobile | Ideally below 2 MB |
What usually weighs down a small store?
Images first. Product photos straight from a camera, 4 MB and 4,000 pixels wide, displayed at 400 pixels. Eight such photos make a page over 30 MB. The heavy images guide shows how to reduce them without losing quality.
Apps and extensions second. Each installed review, popup, chat, or visitor-counter app loads its own code on every page. Half were installed for testing and never removed.
Duplicate tracking scripts third: Meta Pixel installed twice, Google tags three times. And excessive custom fonts, each downloaded before text appears.
What should you remove, and in what order?
- Compress and resize all campaign product images. Highest impact, lowest risk.
- Remove every app whose purpose you cannot explain. Record removals so you can restore them.
- Check that each pixel and tag is installed only once.
- Reduce custom fonts to two: one for headings, one for text.
- Remove autoplay homepage video or replace it with an image and play button.
- Measure again. Repeat until LCP falls below 2.5 seconds.
A decor store has mobile LCP of 6.8 seconds: original 3 MB to 5 MB photos, 11 apps, duplicate pixel. After compressing photos and removing seven apps, LCP drops to 2.1 seconds without changing platforms or hosting. It takes an afternoon.
Be careful what you keep: ZIP-code shipping calculation, store search, and checkout generate sales. If slow, the issue is hosting or the platform; the answer is in testing your website before peak traffic.
What to do now
Run mobile PageSpeed on your best-selling product page and note LCP. Above 2.5 seconds, start with images today. If you prefer a website built for fast loading from the start, see a free prototype in 48 hours: avilaops.com/criacao-de-site-profissional or contact us on WhatsApp: wa.me/5517997811471.
Frequently asked questions
How long can a page take to load?
Google considers the largest element appearing within 2.5 seconds good. Above four seconds, it rates it poor.
Does website speed affect Google?
Yes, mobile speed is one factor Google uses. But the greater effect is direct: slow pages lose visitors before they see products, with or without Google.
Does changing hosts solve slow pages?
Only when the server responds slowly. If heavy images and too many apps are the problem, the page remains slow on any host. Measure before switching.
Turn what you learned into your next step.
Tell us about your company and what you want to improve. We can explore the right tools, integrations or custom project together.